In the dynamic world of secondhand, thrift, and e-commerce, data isn’t just a tool—it’s a game-changer. Whether you’re looking to streamline operations, boost sales, or gain valuable information, effective use of e-commerce analytics and insights propel your business to new heights.
In our recent master class “Reporting Tools: How To Use Metrics to Grow Your Business,” hosted by Drew Purcell, attendees learned practical methods to harness data, create actionable insights, and drive growth.
We explored Upright Lister, a powerful software solution designed for secondhand resellers. Its intuitive dashboards and reports simplify complex data through user-friendly visualizations, enhancing online sales and operational efficiency.
Participants discovered how to enhance their operations by using tailored reporting tools to effectively track key metrics and master sales data, enabling them to understand performance trends and make strategic decisions that optimize results.
We’ll unpack tools and strategies discussed in our latest Master Class to help drive growth for your business. To gain even more insight on this topic, be sure to access our full Master Class here.
The Importance of Data in Secondhand and Thrift E-Commerce
Data helps businesses make informed decisions, identify trends, and address challenges efficiently. Leveraging data is vital for optimizing operations and enhancing performance, ultimately driving growth and success.
In the secondhand e-commerce space, data plays an important role. It optimizes inventory management by ensuring high-demand products are available while reducing unsold stock. Data-driven insights also enhance pricing strategies, helping sellers set competitive prices that attract buyers. Additionally, effective data utilization streamlines the supply chain, enabling organizations to respond quickly to market shifts and consumer demands.
Historically, the e-commerce industry relied heavily on basic inventory management software for resellers and intuition-based strategies that offered limited insights. However, as technology has advanced, there has been a significant shift toward data-driven decision-making that enables retailers to gain deeper insights into customer behavior and market trends.
According to Gartner, an estimated 65% of B2B sales organizations will shift from intuition-based strategies to data-driven approaches by 2026. This transition highlights the importance of analytics in enhancing e-commerce operational efficiency and strategic planning. Businesses that adopt data-driven strategies can expect to see a remarkable return on investment—driving five to eight times more ROI compared to those that do not leverage data effectively.
Understanding Key Metrics and KPIs for Business Growth
Key Performance Indicators (KPIs) are essential metrics that provide valuable insights into various aspects of business performance. They are crucial for measuring success, as they help organizations assess progress toward goals, identify areas for improvement, and make informed decisions.
Understanding and tracking the right KPIs can be the difference between stagnation and growth.

Common KPIs for E-Commerce and How to Track Them
- Revenue Generation:
Measure sales growth by product categories, marketplaces, or time periods to identify recommerce market trends. This insight helps businesses recognize high-performing areas to focus their efforts, driving revenue growth for secondhand stores. - Productivity Metrics:
Track team performance through data on listings processed, shipping, and order fulfillment. Higher productivity typically leads to cost reductions and improved customer satisfaction, making it essential to identify inefficiencies and streamline processes. - Sell-Through Rate and Average Price Per Item (PPI):
Understand what products sell quickly and where there may be room for pricing adjustments. Analyzing these figures can provide deeper insights into inventory management, guide strategic decisions, and optimize overall performance.
Practical Use of Reporting Tools in Upright Lister
Overview of Lister’s Dashboards and Reports
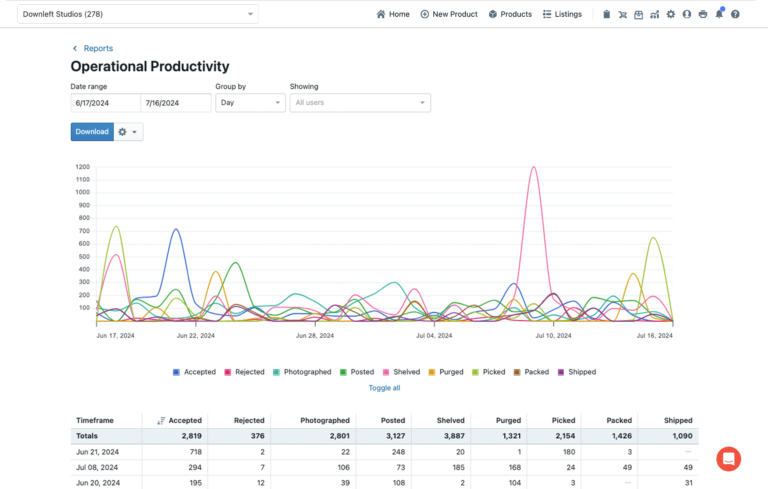
Upright Lister’s user-friendly dashboards provide real-time data that empower e-commerce businesses to make informed decisions. These intuitive visualizations present key metrics such as sales performance, inventory status, and user productivity, all in one place.
Downloadable Reports
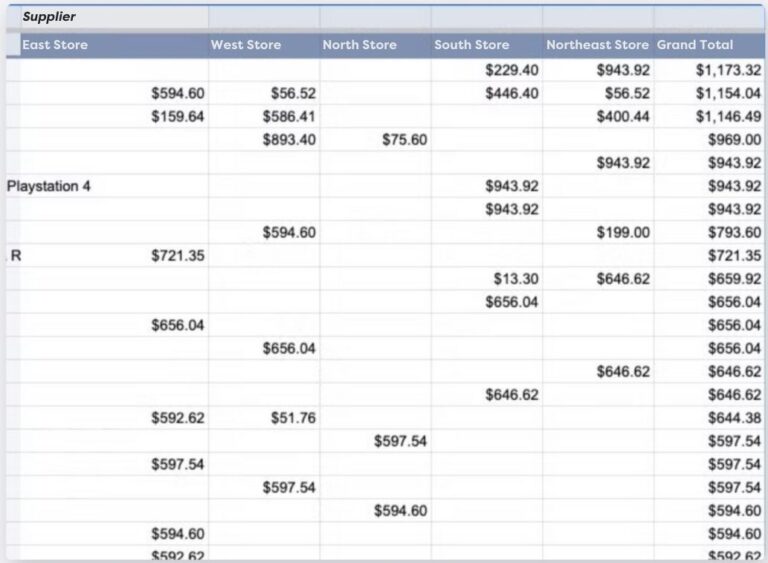
For advanced users seeking granular data to enhance their reporting capabilities, Upright Lister offers downloadable reports. With this feature, users can export data in CSV format to integrate it with external tools like Excel or Google Sheets for customized reporting. Businesses can use downloadable reports to track product performance across multiple channels, supporting cross-channel e-commerce posting. This offers comprehensive insights into your entire workflow—from accepting manifest items to shipping orders and managing inventory.

Establishing and Measuring KPIs Using Reporting Tools
Data Collection: Setting the Foundation
Establishing effective KPIs starts with thorough data collection and applying best practices for gathering relevant, accurate, and actionable data. Start by defining your key business questions. For example, consider things like:
- Which products have the highest sell-through rate?
- Where are the operational bottlenecks hindering productivity?
When collecting data, select a time period that provides informative results—typically, a minimum of three months is advisable. This time frame allows for a clearer understanding of trends and patterns, ensuring that your KPIs are based on sufficient data to drive meaningful insights.
To help you measure performance, here are a couple KPIs and the corresponding reports available in Upright Lister:
- Paid Order Items Report:
This report shows the total number of sales within a specific timeframe and provides details about those items, such as product category, title, and supplier. Businesses use this report to derive KPIs like total revenue and sell-through rate. - Listings Reports:
These reports track the number of new listings and relistings, which can inform KPIs such as inventory turnover and listing productivity.
Organizing and Analyzing Data for Trend Identification
Once you have gathered your data, the next step is organizing and analyzing it to identify trends. Utilizing Lister’s reporting tools, you can segment data by various categories, time periods, and suppliers, enabling a comprehensive analysis of your business performance.

For instance, let’s consider a client who aims to optimize their sales strategies for peak holiday shopping season. They utilized Paid Order Items Report to analyze sales data from October to December the year prior. This revealed that certain product categories outperformed others during these months.
To take it a step further, this client used the Listings Report to assess their listing activity during peak season. By comparing listing frequency against sales performance, they identified that a higher number of listings correlated with increased sales, particularly in specific categories. This insight led them to strategize for the following year, increasing inventory of their top-selling items ahead of peak periods to capitalize on the demand.
Curious what the top selling brands are during peak season? You’re in luck! We already organized and analyzed our data from thousands of brands sold through Upright Lister last year to provide you with our Top E-Commerce Brands Guide for this year. Access our free guide here!
Using Data to Drive Growth and Improve Efficiency
Real-Time Adjustments and Continuous Improvement
Businesses can leverage real-time dashboards to monitor operations and quickly address inefficiencies. For instance, if listing items has slowed, a business can immediately analyze data to identify bottlenecks, such as insufficient resources, and take corrective action to improve operations.
Along with this comes data transparency. When teams have access to real-time data, it enhances their overall productivity. Employees can take a proactive approach to make informed decisions, manage inventory effectively, and reduce waste by identifying slow-moving stock or excess inventory.

Creating a Culture of Data-Driven Decision Making
Fostering a culture of data-driven decision-making is essential for leveraging the full potential of analytics. Encouraging teams to embrace data tools promotes collaboration and enhances overall performance. When employees understand how to utilize data insights, they become empowered to contribute to strategic initiatives to drive collective growth.
Tools like Lister’s Operational Productivity and User Productivity reports provide a clear view of team actions, including manifesting, photography, posting, and shipping. Analyzing data from these work stations allows teams to monitor their average productivity across different tasks over time, enabling them to set realistic benchmarks. This is useful when onboarding new employees, because managers can compare their performance against established team averages. This data-driven approach not only helps new hires understand expectations but also identifies areas for improvement, ensuring everyone is aligned and contributing toward common objectives to drive growth.
Advanced Reporting Features for Large-Scale E-Commerce Operations
Custom Reports for Unique Business Needs
Upright Labs offers robust reporting capabilities that enable businesses to create tailored reports designed to meet specific operational requirements. With comprehensive analytics tools, users can gain valuable insights that shape custom e-commerce growth strategies across their operations.
Here are some key areas where custom reports can provide significant benefits:
- Inventory Optimization:
Track stock levels and turnover rates to ensure high-demand products are readily available while minimizing excess inventory. - Sales Forecasting:
Predict future sales trends using historical data, which is especially useful for managing seasonal inventory. - Supplier Performance Monitoring:
Gain insights into supplier reliability, lead times, and quality to make informed sourcing decisions.
“We so appreciate the custom reporting. [Upright] really does a good job of finding what we need to focus on to improve our revenue.”
E-Commerce Team at Goodwill Southern NJ
Integrating Data Across Platforms for Unified Strategy
Lister’s reporting tools can be integrated with other e-commerce platforms for cross-channel analysis. Businesses can then leverage this data to identify sales trends and opportunities for diversification. By harnessing the power of integrated data, e-commerce businesses can adopt a unified strategy to ensure they remain competitive across all channels.

Key Takeaways, Next Steps, Closing
As we’ve explored throughout this blog, effective reporting tools are essential for transforming your e-commerce business. By leveraging real-time insights, you can improve productivity and implement data-driven growth strategies that drive success. Custom reports, cross-channel analysis, and continuous monitoring allow businesses to respond proactively to market demands and optimize their operations.
Data is a powerful tool, and Upright Lister’s reporting features make it easier than ever to unlock its potential. Are you ready to grow your business through data-driven decisions?
To dive deeper into these concepts, you can watch our Master Class and see how data can elevate your e-commerce strategy. Or, you can schedule a personalized demo.


